Purpose
Background: Pathogenic variants in the ITGA3 gene have been linked to disruptions of the cell-matrix in the lungs, kidneys, and skin in a condition collectively known as ILNEB. The immune system has been recognized as a contributing factor to worsening of the condition albeit the potential mechanisms have not been explored. In this study, a multi-omic approach was employed to investigate the involvement of immune drivers in ILNEB.
Methods: We analyzed long-read DNA/RNA to identify phased single-nucleotide and structural ITGA3 variants, annotated with SnpEff/SnpSift and gnomAD, and cross-validated using genome/RNA reads, DECIPHER, and isoform comparisons. Spatial lung proteomic images were processed in QuPath to visualize co-localization of myofibroblasts and M2-macrophages using fibrosis-related markers. Single-cell RNA-seq peripheral blood mononuclear cells (PBMC) data from patient and healthy samples were processed in Seurat for quality control, clustering, annotation with Azimuth, differential expression, and pathway enrichment. Olink NPX proteomics from four PBMC conditions were clustered and Reactome-enriched, yielding five protein-response patterns that qualitatively describe disease-associated immune dysregulation.
Results*: Our analysis identified two rare, functionally supported variants on opposing haplotypes and on opposite alleles. We also identified a secondary ~1600 bp biallelic intronic insertion at chr17:50086103. Spatial proteomic analysis revealed a distinct immune microenvironment with increased expression of alpha-smooth muscle actin (SMA) and vimentin. Single-cell RNA-seq analysis identified 27 distinct cell populations with an increase in CD4 central memory cells, CD14 and CD16 monocytes, and CD56 NK cells increased in the patient sample as opposed to the healthy sample. SYNM, SNED1, FMN1, and HLA-C genes were upregulated across several cell types. Numerous proteomic signatures were found to co-exist within the systemic circulation with co-elevation of TGM2 and GZMH.*
Conclusion: Our findings reveal complex immune processes underlying ILNEB, with potential diagnostic and therapeutic implications.
Introduction
Interstitial lung disease, nephrotic syndrome, and epidermolysis bullosa (ILNEB) is a rare multisystem disorder caused by pathogenic variants in the ITGA3 gene, which encodes the α3 integrin subunit, a critical component of the α3β1 integrin receptor involved in epithelial adhesion, basement membrane organization, and intracellular signaling 1–3. Loss of α3 integrin function disrupts cell–matrix interactions in multiple organs, particularly the lungs, kidneys, and skin, producing a severe clinical phenotype characterized by interstitial lung disease, congenital nephrotic syndrome, and epidermolysis bullosa 4–5. The majority of the 11 patients identified with this condition develop nephrological and respiratory manifestations in the first few weeks of life, which result in a fatal outcome in early infancy or childhood 6. To date, only one individual with the pathogenic ITGA3 variant has survived to adulthood 6. Since its first description, the molecular mechanisms linking the underlying genetic defect to progressive multisystem injury remain incompletely defined.
Chronic immune activation is increasingly recognized as a significant, often underappreciated driver of disease progression in many rare inherited disorders 7. Persistent epithelial injury can trigger release of danger-associated molecular patterns that activate innate immune pathways, promote leukocyte recruitment, and sustain systemic inflammation 8–11. Over time, this may amplify tissue damage through maladaptive immune signaling, complement activation, and aberrant wound-repair responses. In ILNEB syndrome, recurrent tissue injury across several organ systems raises the possibility that immune dysregulation is not merely secondary to tissue damage but may represent a central biological process driving disease severity. Defining this relationship is particularly important because inflammatory pathways may provide therapeutically actionable targets in a condition for which no disease-modifying treatment currently exists.
Advances in multi-omic technologies now make it possible to interrogate disease biology across multiple molecular layers, offering a more integrated view of pathogenic mechanisms. Proteomics can identify circulating and cellular signatures of immune activation, transcriptomics can reveal altered gene expression and splicing events, and genomic analysis can clarify the contribution of both primary and secondary variants to disease expression 12–15. When combined, these approaches provide a systems-level framework for understanding how a single-gene disorder can lead to widespread biological disruption. Rather than focusing solely on the structural consequences of ITGA3 deficiency, a multi-omic strategy can uncover downstream pathways that may mediate disease progression and explain phenotypic heterogeneity.
The present study applies an integrated multi-omic approach to investigate the molecular basis of ILNEB syndrome in a patient, with particular emphasis on the immune system as a potential driver of pathology. By combining proteomic profiling with complementary genomic and transcriptomic analyses, this work aims to characterize the extent of immune dysregulation in an affected patient and to determine whether inflammatory signaling represents a core component of disease biology. Establishing immune activation as a central feature of ILNEB syndrome may not only improve understanding of this rare disorder but also provide a foundation for exploring targeted immunomodulatory strategies in future therapeutic development.
Methodology
Analysis of long-read DNA/RNA data for variant identification and characterization
Phased, biallelic chr17 single-nucleotide and structural variants overlapping the ITGA3 gene (chr17:50,056,110-50,090,481 with a +/- 10kb buffer) were extracted from DeepVariant and sawfish-derived whole genome variants from the patient blood sample using bcftools. All variants were annotated using SnpEff and SnpSift, and gnomAD variants based on the GRCh38 reference genome. We identified 2 similar intronic insertion structural variants, one per haplotype. We annotated 74 SNVs, most of which were intronic. The variants were individually assessed using genome and RNA reads and supported by the decipher database 16 to enable classification and potentially identify their specific impact and consequences. In addition, we compared transcript isoform classification files from the patient and control samples to identify unique isoforms.
Spatial lung proteomics image analysis
The 2022 spatial proteomics image from the patient was visualized using QuPath (v.0.7.0). Raw image files were imported, and the image type was set to fluorescence. Representative regions of interest (ROIs) were selected to demonstrate the co-localization of myofibroblasts and M2-macrophages. Key markers α-smooth muscle actin (SMA), collagen IV, vimentin, CD163 and CD206 were selected based on their involvement in the lung fibrotic process 17–27.
Single-cell RNA sequencing analysis
Downstream sc-RNASeq analysis was conducted using the Seurat package in R 4.3.1. Quality control filtering was performed separately for the sample from the healthy individual and the patient based on mitochondrial read percentage, total RNA counts, and the number of detected genes per cell. Cells were retained for further analysis if they had more than 200 and fewer than 4000 detected genes. After quality control, dimensionality reduction, and clustering were performed. Principal component analysis was performed using the first 50 principal components, followed by a combination of visual assessment and quantitative selection of the final principal components. The selected components were retained for graph-based clustering with a resolution of 0.6 to identify similar cell populations. UMAP dimensionality reduction was performed using the selected components, and the resulting embeddings were visualized by sample condition (healthy versus patient) to evaluate cell distributions within clusters by condition. Cell clusters were annotated to known cell types using Azimuth with the PBMC reference dataset (pbmcref). Differential gene expression analysis was performed within individual annotated cell populations in both patient and healthy conditions, using a Wilcoxon rank-sum test, and pathway enrichment was assessed using the Gene Ontology and Reactome databases.
Olink proteomics profiling of PBMCs
Normalized Protein Expression (NPX) data from 5,416 Olink-profiled proteins across four PBMC/plasma conditions were analyzed. Low-confidence proteins were excluded using an expression threshold of >100 counts, yielding ~4,420 proteins. NPX values were z-score standardized and subjected to hierarchical clustering using Euclidean distance with complete linkage. The optimal number of clusters was determined using the elbow and silhouette methods, with k = 5 selected for biological relevance. Clustered proteins were then analyzed by Reactome pathway enrichment to identify functional patterns. Because each condition had n = 1, results were interpreted qualitatively to identify disease-related immune dysregulation trends rather than inferential statistical differences. Protein expression values were z-score scaled across conditions and hierarchically clustered into five groups based on similarity of response patterns. Clusters represent distinct biological behaviors: C1, disease-specific activation with protein levels elevated in the patient beyond stimulated controls; C2, stimulation-induced proteins that are reduced in the patient (loss of activation); C3, proteins active at baseline in healthy controls but suppressed in disease; C4, proteins enriched in healthy baseline and reduced upon stimulation and in disease; and C5, proteins suppressed upon stimulation but elevated in the patient.
Results and discussion
Long-read RNA analysis variant identification and characterization
Primary findings indicate compound heterozygosity. Two rare, functionally supported variants were identified on opposing haplotypes (Table 1). These variants occur on opposite alleles (confirmed by long-read phasing), satisfying the biallelic requirement for recessive disease. The Variant column lists variant nomenclature, while Haplotype identifies genomic phase (Hap1 = 0|1, Hap2 = 1|0, as in IGV). MAF shows minor allele frequency from DECIPHER, ClinVar provides clinical annotation from ClinVar, and Computational reports in silico classification. The Notes column summarizes ACMG/AMP criteria and functional consequences (for example, missense). Current evidence is insufficient to assess the significance of the remaining variants.
| Variant | Haplotype | MAF | Clinvar | Computational | Notes |
|---|---|---|---|---|---|
| Chr17:50077122 G>A | Hap 1 | 7.19×10⁻⁷ | Pathogenic | Deleterious | Splice donor, PM2, PS1, PP3. Likely pathogenic |
| Chr17:50077024 C>G | Hap 2 | 6.57×10⁻⁶ | VUS | Deleterious | Missense, threonine>arginine (polar uncharged AA to +vely charged AA; structural protein changes); PM2, PP3. Potential second-hit candidate |
Table 1. Biallelic variants on opposing alleles with clinical and computational annotation
A secondary ~1600 bp biallelic intronic insertion at chr17:50086103 was identified; however, its functional significance remains unclear. Sequence interrogation by BLAST returned no significant matches, and the affected region showed no overlap with annotated regulatory elements in the UCSC Genome Browser, limiting interpretation of its biological relevance. In contrast, long-read RNA sequencing from hair follicle tissue provided functional evidence for the hap1 splice donor variant (chr17:50077122), demonstrating allele-specific intron retention. Reads carrying the alternative allele showed continuous alignment across the exon–intron junction, consistent with impaired intron excision, whereas reference allele reads displayed normal splicing. Despite this splice defect, isoform-level comparison did not identify a patient-specific aberrant transcript relative to the control.
Spatial proteomics image analysis
The spatial proteomic profile of lung tissue from the patient in 2022 demonstrates a profoundly remodeled alveolar microenvironment characterized by epithelial instability, mesenchymal activation, and immune-driven fibrogenesis.
Pathogenic variants in ITGA3 disrupt the formation of functional integrin α3β1 28 a laminin-binding receptor essential for epithelial adhesion to the basement membrane and for the preservation of alveolar integrity. Loss of this adhesion complex has been shown to result in severe interstitial lung disease accompanied by architectural destruction of the distal lung 29. Spatial proteomic imaging (Figure 1) of lung tissue from the patient reveals a distinct immune microenvironment characterized by altered structural organization and localized inflammatory signaling within the fibrotic lung.
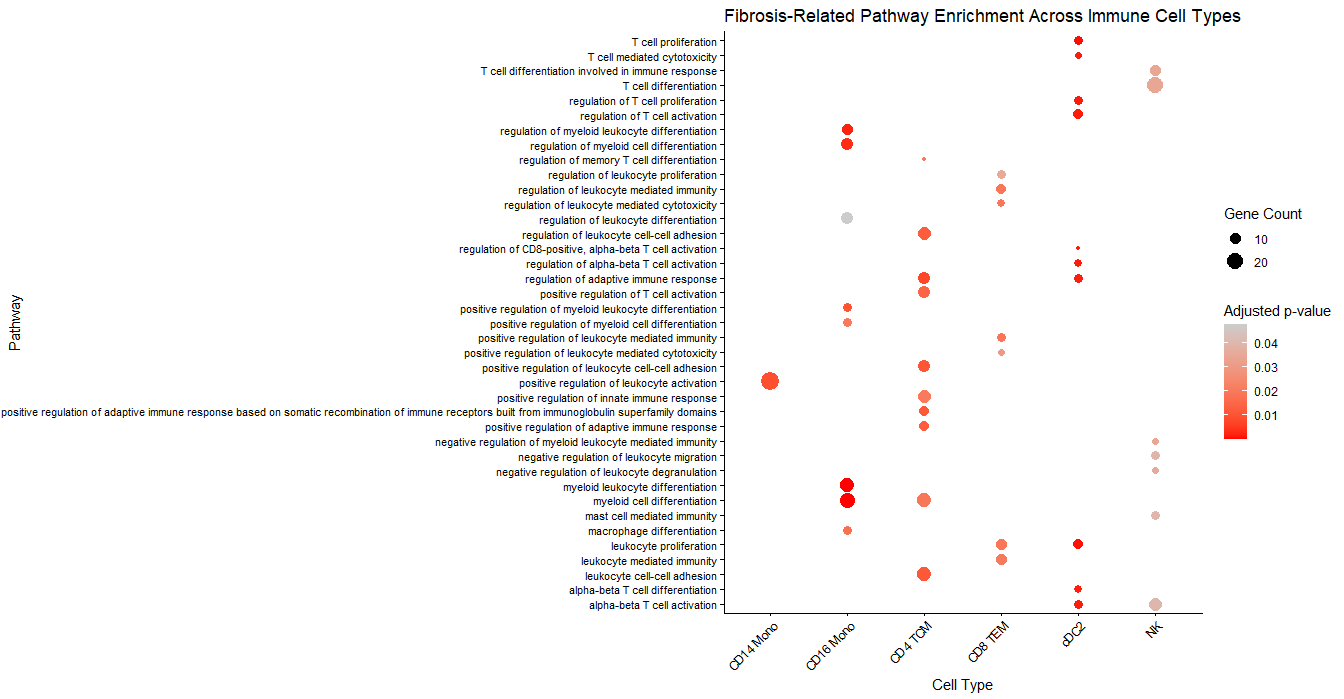
Figure 1. Spatial proteomics imaging of ITGA3-related lung fibrosis showing an immune landscape at a scale bar of 100 µm
In Figure 1, Collagen IV, together with DAPI, highlights marked distortion of the alveolar basement membrane and loss of normal airspace organization. Under physiological conditions, integrin α3β1 (ITGA3) anchors epithelial cells to the extracellular matrix 30, thereby maintaining the structural continuity of the alveolar-capillary barrier. In the absence of normal ITGA3 signaling, this interface becomes unstable, promoting epithelial detachment and progressive collapse of alveolar spaces. The observed parenchymal filling, therefore, likely reflects the replacement of functional alveoli by fibrotic tissue, a hallmark of advanced interstitial remodeling in hereditary fibrotic lung disease 29.
A prominent feature of the tissue is the increased expression of α-smooth muscle actin (SMA) and vimentin, indicating expansion of activated mesenchymal cells within the interstitium. Co-expression of these markers is consistent with fibroblast differentiation into contractile myofibroblasts, the principal effector cells responsible for excessive extracellular matrix production and progressive tissue stiffening in pulmonary fibrosis. Vimentin expression further supports a mesenchymal phenotype and may indicate cellular plasticity within the injured alveolar compartment. These findings suggest that aberrant matrix remodeling is actively ongoing rather than representing a static scar.
Notably, the diffuse or smeared appearance of SMA staining appears to represent a biologically meaningful feature rather than a staining artifact. One explanation is the occurrence of epithelial–mesenchymal transition (EMT)-like processes, in which injured epithelial cells lose polarity and begin to express mesenchymal proteins such as vimentin and SMA. In the context of ITGA3 deficiency, disruption of epithelial adhesion, particularly the loss of E-cadherin (observed in our profile but not shown in the provided figure), may facilitate this phenotypic transition, leading to cells with partial epithelial and mesenchymal characteristics 31–33. A second explanation is the widespread dispersion of activated stromal cells due to basement membrane failure, leading to the leakage of contractile proteins into collapsed alveolar spaces. Additionally, α-SMA is increasingly recognized as an imperfect surrogate for collagen-producing fibroblasts, as many fibrogenic cells express it only variably or in fragmented patterns 34–35. Therefore, the irregular SMA distribution may reflect a mixed population of transitional and matrix-producing cells rather than a sharply defined myofibroblast focus.
The enrichment of CD206- and CD163-positive macrophages within fibrotic regions further indicates the presence of a profibrotic immune niche. These markers are commonly associated with alternatively activated macrophages, which promote tissue remodeling by secreting transforming growth factor-β, platelet-derived growth factor, and other fibroblast-activating mediators 36. Their spatial proximity to SMA-positive stromal cells suggests reciprocal signaling between macrophages and fibroblasts, which may amplify local fibrogenesis and contribute to persistence of the pathological lesion. Rather than being uniformly distributed, these cells appear concentrated in discrete microdomains, supporting the concept that fibrosis develops through localized multicellular niches of sustained injury response 37.
The merged multiplex images reveal substantial spatial heterogeneity, with clusters of mesenchymal and immune cells occupying regions adjacent to partially preserved alveolar structures. Such heterogeneity is increasingly recognized as a defining feature of fibrotic lung disease, where neighboring regions may simultaneously display active remodeling and residual architecture. The colocalization of SMA, vimentin, and macrophage markers within these hotspots suggests that the disease process is not diffuse at the molecular level but instead organized into focal zones of intensified pathogenic signaling.
Collectively, these findings indicate that ITGA3-related lung fibrosis is characterized by the convergence of epithelial detachment, diffuse mesenchymal activation, and macrophage-mediated remodeling within a spatially heterogeneous fibrotic niche. The observed replacement of normal alveolar spaces by disorganized cellular and extracellular components provides mechanistic insight into how defective integrin-mediated adhesion can drive progressive and ultimately destructive pulmonary fibrosis in ILNEB-associated disease.
-
Single-cell RNASeq analysis result
Clustering analysis using UMAP dimensionality reduction of integrated patient and healthy PBMC single-cell RNA sequencing data identified 27 distinct cell populations, including major innate and adaptive immune lineages (Fig. 2A). The immune cell types demonstrated broad intermixing in both patient and healthy samples. The most abundant cell types include natural killer (NK) cells, CD4 central memory cells, CD8 effector memory cells, and CD14 monocytes (Fig. 2B). The immune cell types with a high proportion in the patient compared to the healthy individual include CD4 central memory cells, CD14 monocytes, CD16 monocytes, regulatory T cells (Treg), and CD56bright NK cells (Fig. 2B) representing an intermix of innate and adaptive immune cell types. Pathway enrichment analysis of differentially expressed genes in CD14 monocytes revealed a significant enrichment of leukocyte activation, suggesting that these cells are being primed for inflammation (Fig. S1). Differential gene expression analysis of selected immune cell types revealed a few common genes across several cell types, including SYNM, SNED1, FMN1, and HLA-C (Fig. 2C). The differentially expressed genes for selected cell types are presented in Table 2. The SYNM gene encodes synemin, which provides important structural support in muscle tissues 38. Synemin has also been found to be upregulated in hepatic fibrosis 39. The potential role of synemin in pulmonary fibrosis is unclear. The SNED1 gene encodes SNED1, which is an extracellular matrix protein. SNED1 has also been reported to be upregulated in idiopathic pulmonary fibrosis 40, but this finding has not been demonstrated in ILNEB-associated fibrosis. FMN1 is a gene within Network 1, which is a differentially methylated region network previously shown to decrease in metabolic dysfunction-associated steatotic liver disease (MASLD)-associated fibrosis. Further studies are needed to fully characterize the potential role of FMN1 in pulmonary fibrosis. The HLA-C gene has been implicated in adaptive immune responses and T-cell-mediated cytotoxicity, and encodes HLA-C, a ligand for killer-cell immunoglobulin-like receptors expressed on natural killer (NK) cells 41. Inhibition of natural killer cells could contribute to reduced clearance of senescent cells, including fibroblasts 42. Our analysis revealed a contrasting pattern in NK cell proportions: the overall NK population was lower in the patient sample than in the healthy sample, whereas the reverse was observed for CD56bright NK cells, suggesting reduced cytotoxicity associated with NK cells. Furthermore, the CD56bright NK cells exhibited a predominantly loss-of-function profile, with 2 upregulated and 11 downregulated genes. CD56bright NK cells were excluded from the GO enrichment analysis since only two differentially expressed genes passed the significance threshold. GZMH transcript levels were significantly reduced in the patient's NK cells (Fig. S3), whereas GZMH protein levels were elevated in the patient's O-link proteomic analysis. Additional cytotoxic cell types could contribute to elevated GZMH protein levels in plasma. Elevated HLA-C may inhibit NK cell activity and impair surveillance of senescent fibroblasts. The increased proportions of CD56bright NK cells, CD14/CD16 monocytes, and CD4 T cells also suggest that pro-inflammatory cytokines are produced, thereby triggering a chronic inflammatory state, worsening the fibrotic state.
Table 2. Upregulated genes in patient versus healthy sample across immune cell types
| Immune Cells | Upregulated Genes |
|---|---|
| CD4 TCM | FMN1, HLA-C, SNED1 |
| NK | HLA-C, KLRB1, FCER1G |
| CD8 TEM | FMN1, HLA-C, SYNM |
| CD14 Mono | HLA-C |
| CD16 Mono | HLA-C, HLA-DRB1, TMTC1 |
| Treg | HLA-C, RPS29 |
| CD4 Naive | HLA-C, FMN1 |
| CD8 Naive | HLA-C |
| B Naive | HLA-C |
| CD8 TCM | FMN1, HLA-C, SNED1 |
| CD4 TEM | HLA-C, FMN1, IRF1 |
| B intermediate | HLA-C |
| CD4 TCL | FMN1, HLA-C, SYNM |
| CD56bright NK | HLA-C |
| gdT | FMN1, SYNM |
| MAIT | HLA-C |
| cDC2 | HLA-DQA1 |
TCM: central memory T cells, TEM: effector memory T cells, Mono: monocytes, NK: natural killer, Treg: regulatory T cells, TCL: T-cell lymphocyte, MAIT: mucosal-associated invariant T cells, cDC2: conventional dendritic cell type 2
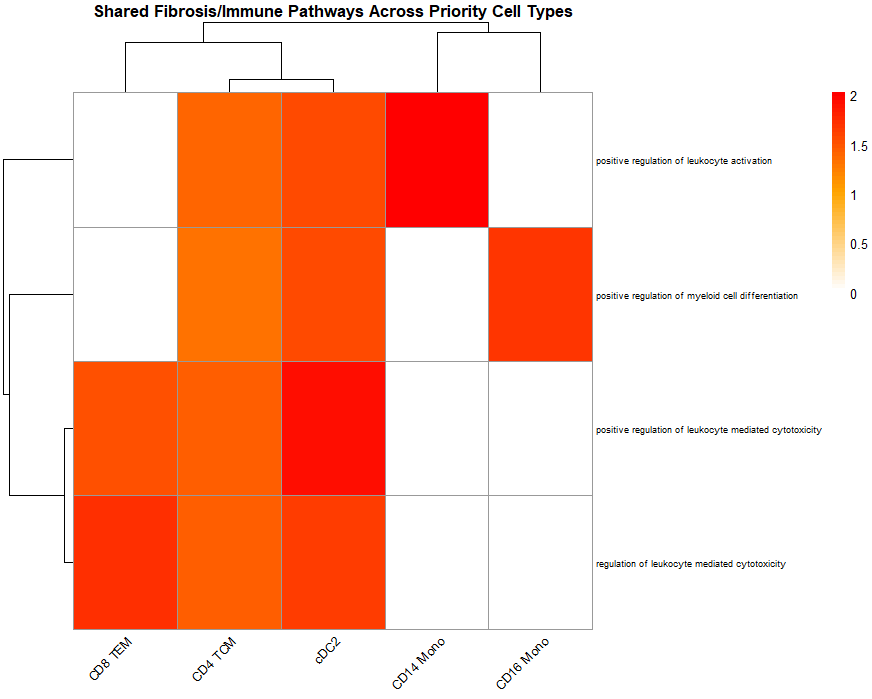
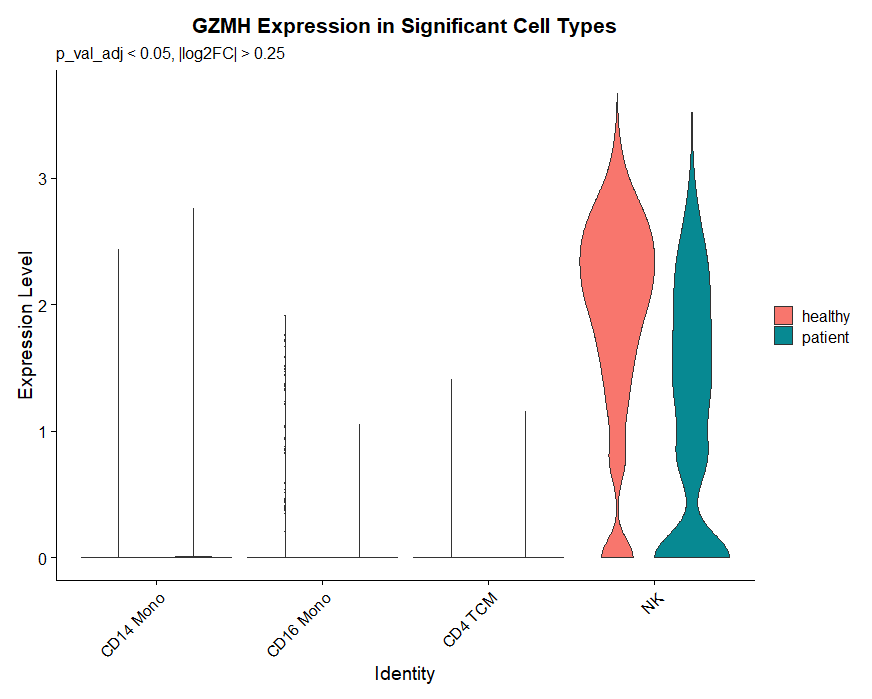
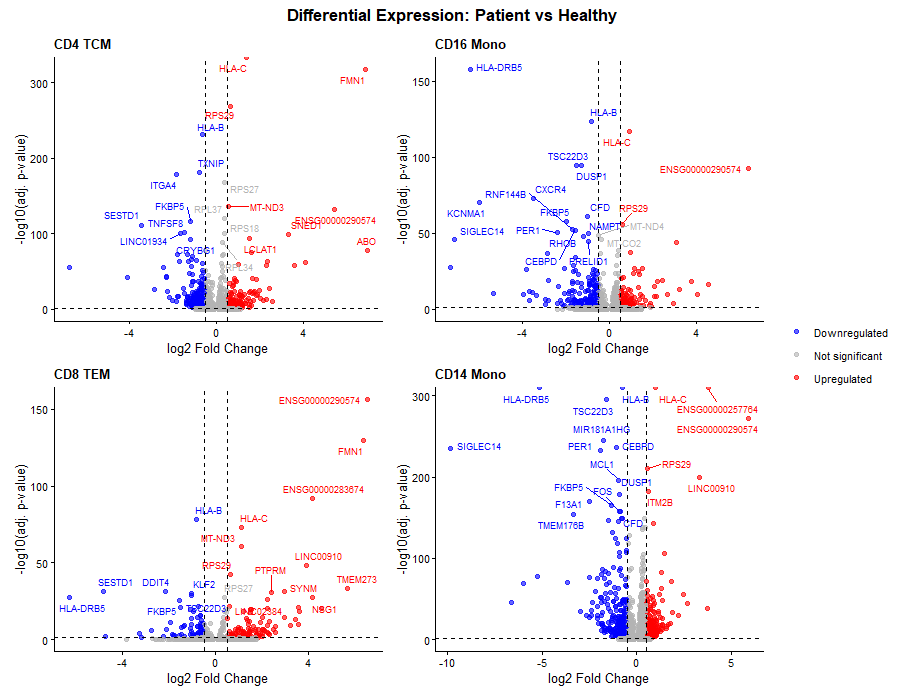
Figure 2. Cluster and immune subtype illustration from single cell-RNASeq. (A) Cell cluster from UMAP stratified by condition. (B) Immune subtype proportions between the healthy control and the patient. (C) Volcano plots of differentially expressed genes in four immune cell types. Genes that were downregulated are colored blue, and those that were upregulated are colored red.
The data in Figures 2 and 3 suggest that the patient's lung is undergoing a massive immune-mediated attack, showing that these cells are not just present in the blood but are actively infiltrating the lung tissue. The widespread CD56 (natural killer NK cells/T cell subsets) signal indicates a significant presence of these innate and adaptive immune cells throughout the lung architecture. CD8 highlights the cytotoxic T-cell population, which is expanded in the patient, as seen in Figure 2. The co-localization of CD56 and CD8 indicates a possible high immune activity and inflammation. This suggests that pulmonary fibrosis is occurring in the same physical space as a massive, abnormal immune infiltration.
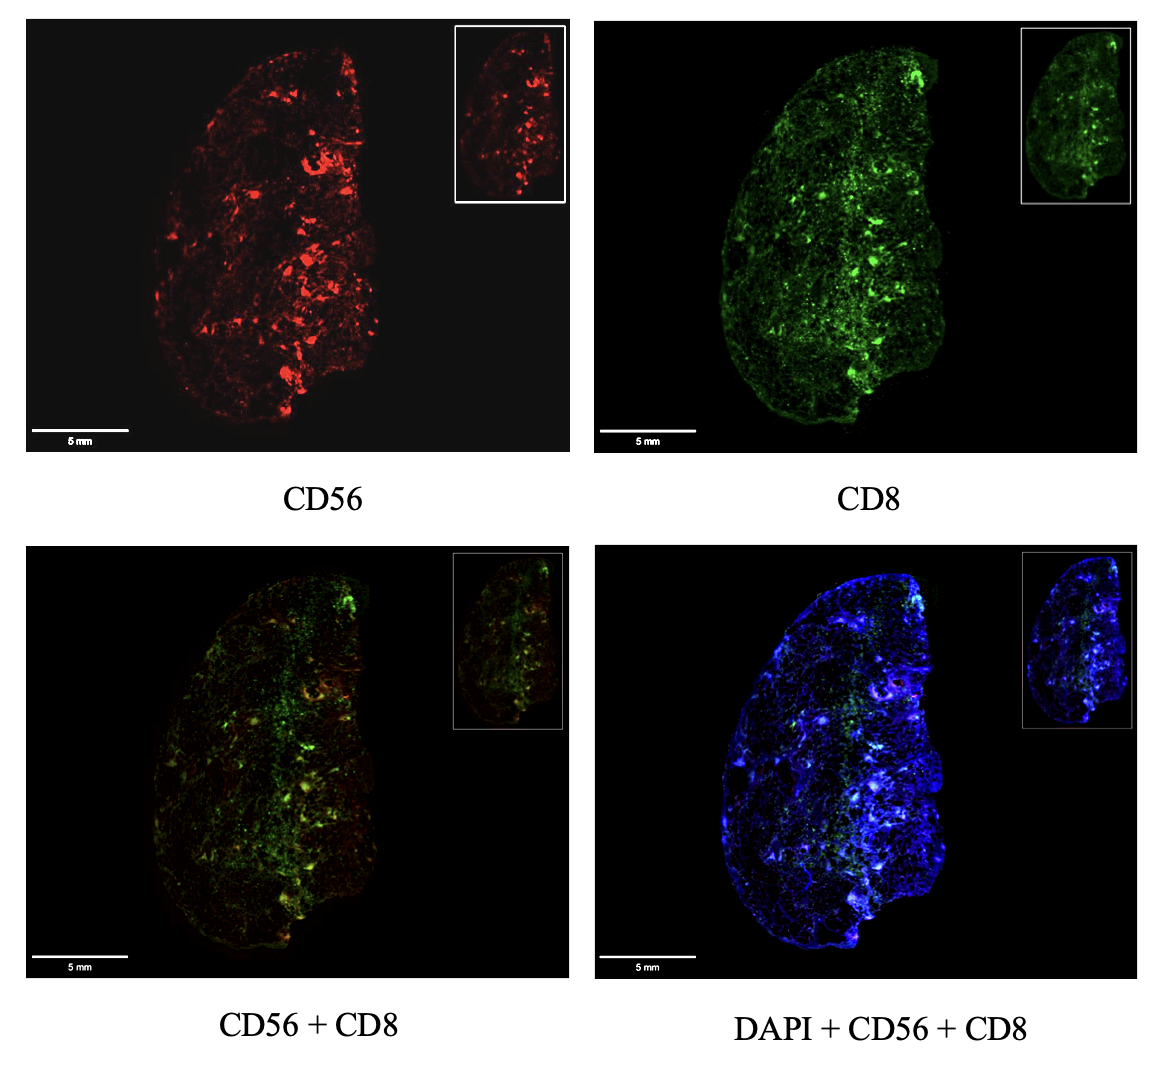
Figure 3. Spatial proteomics lung imaging of CD8+ and CD56+ cell distribution. Scale bar = 5 mm.
Olink proteomics analysis result
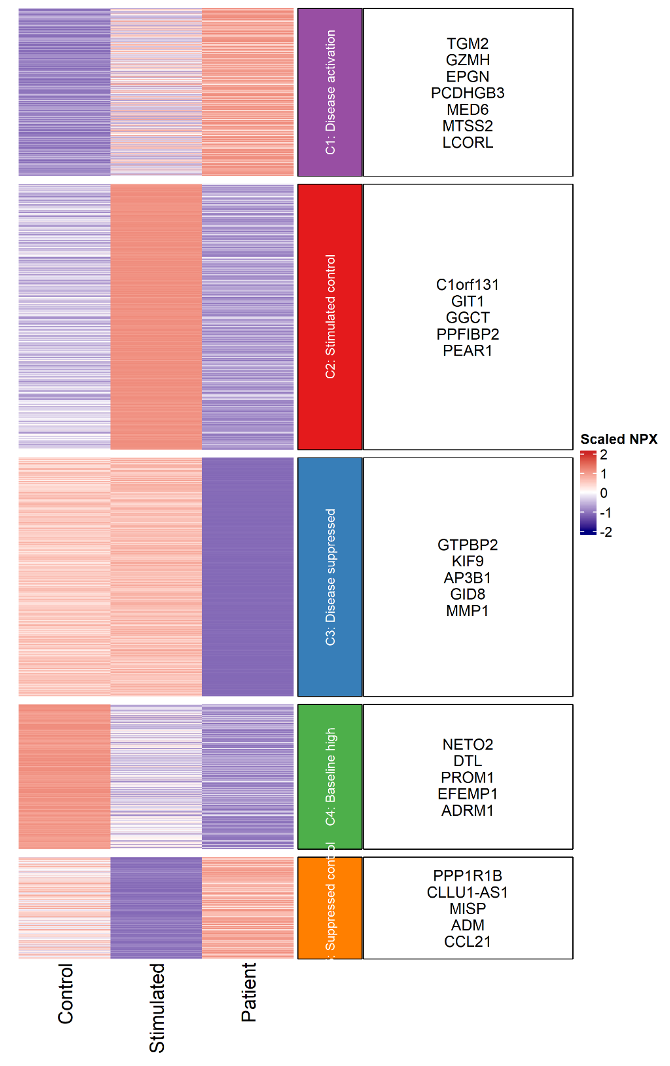
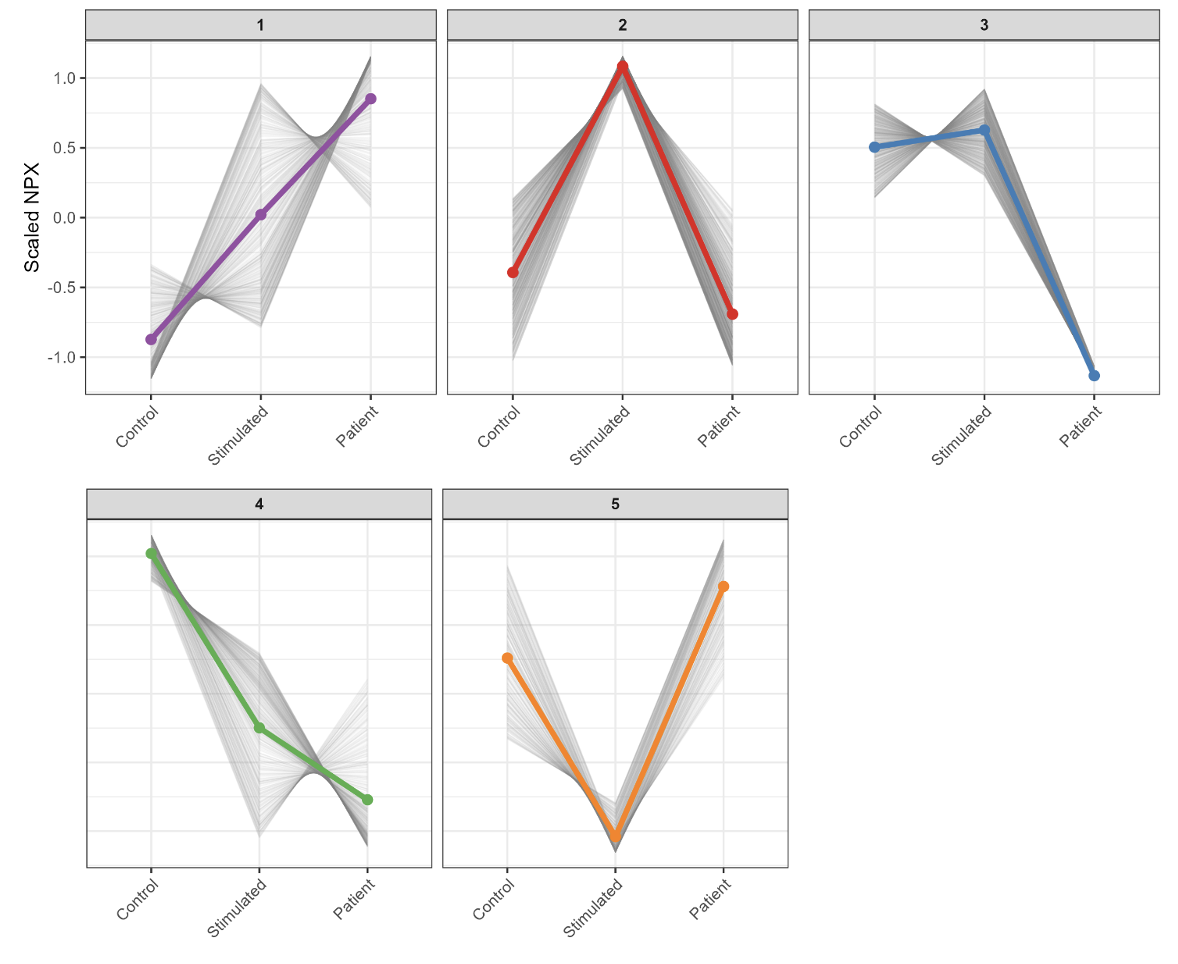
This analysis reveals that many proteomic signatures coexist within the systemic circulation at once. The most striking observation from the clustering identified patterns of disease-specific activation (Figure 4A and B), which was higher for a subset of proteins in this cluster, for example, Transglutaminase 2 (TGM2)- ECM crosslinker protein and Granzyme H (GZMH)- Host cytotoxic effector protein (Figure 4A cluster 1). TGM2 and GZMH promote tissue hardening (fibrogenesis) and impair tissue repair. TGM2 acts as an extracellular engine for matrix stiffening and stabilization, while GZMH functions as a specialized effector that can promote persistent injury and dysfunctional remodeling, often by working alongside other immune cells 43–44. There are also patterns of suppression of baseline pathways observed from the proteome of the patient's physiological immune responses (Figure 4C cluster 3), pointing to patterns of immune dysregulation. Specifically, clusters 2 (neutrophil degranulation) and 4 (complement cascade) point to a significant dysregulation of the innate immune system, as excessive neutrophil degranulation can promote collateral tissue injury through uncontrolled release of antimicrobial enzymes, while abnormal complement activation is strongly linked to chronic inflammatory and autoimmune pathology 45–48. The interaction between activated complement proteins and neutrophils forms a self-perpetuating, bidirectional feedback loop that drives chronic inflammation. This Neutrophil Extracellular Traps (NET)-complement axis is exceptionally difficult for the body to terminate because the products of each system activate the other, leading to sustained tissue damage (45,49,50).
The overall pathway enrichment (Figure 4C) further highlights alterations in immune signaling, vesicle trafficking, complement activation, and metabolic processes. While less directly immune-related than the others, pathways like Rab regulation of trafficking and GPCR ligand binding are essential for how immune cells move and communicate. Rab proteins manage the internal logistics (trafficking) of receptors and signaling molecules, while GPCR ligand binding on the surface provides the external directional cues required for migration and communication 49–53.
The major takeaway is a profound dysregulation of the immune landscape at the proteomic level in the systemic circulation, where excessive activation of specific immune pathways appears to coexist with functional exhaustion of others, highlighting a complex and potentially maladaptive immune imbalance.
A
B
C
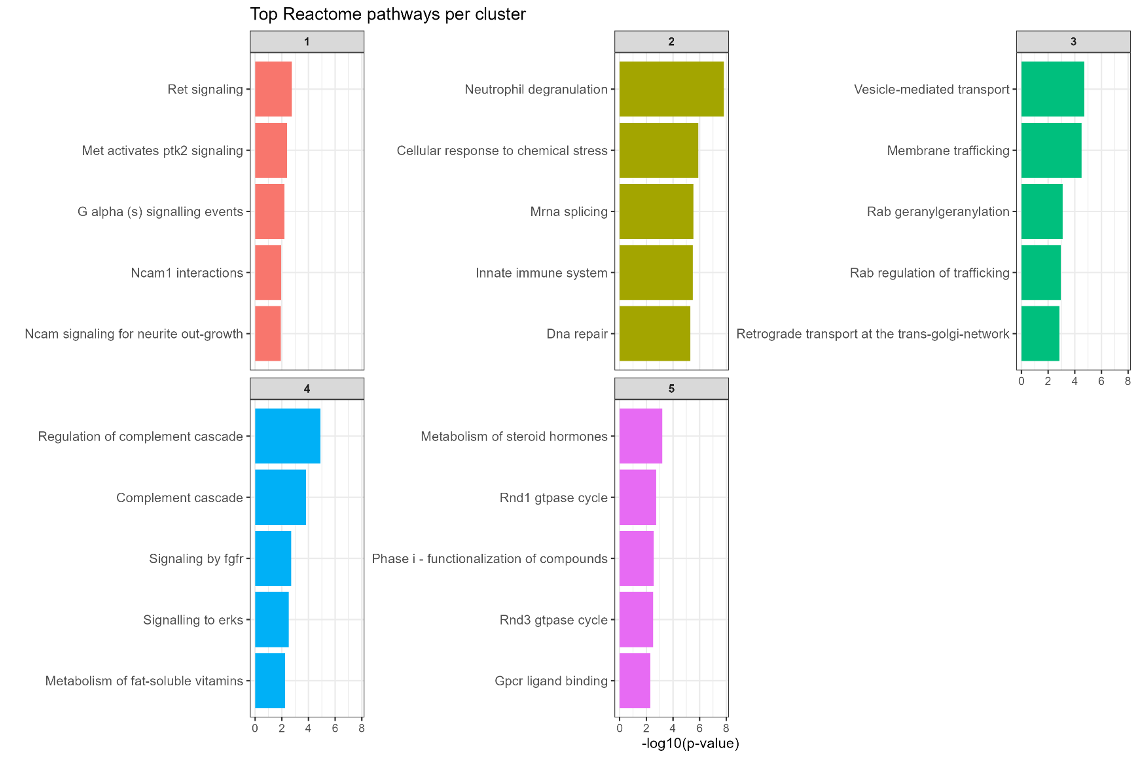
Figure 4. Plasma proteomics clustering (A) Disease and stimulation response profile. Heatmap of scaled NPX values for proteins measured in PBMCs under three conditions: healthy control (Control), ex vivo stimulated control (Stimulated), and patient (Patient). Colored bars indicate cluster identity. Representative proteins from each cluster are shown alongside the heatmap. Color scale represents relative expression (scaled NPX), with red indicating higher and blue indicating lower expression. (B) Cluster profile across conditions. Line plots showing scaled NPX values for proteins grouped into five clusters based on hierarchical clustering of expression patterns. Each grey line represents an individual protein, while the colored line indicates the cluster mean profile. Expression is shown across three conditions: healthy control (Control), ex vivo stimulated control (Stimulated), and patient (Patient). (C) Cluster specific pathway enrichment. Bar plots showing the top Reactome pathways enriched within each protein cluster. Pathways are ranked by p-value, and significance is represented as −log10 (p-value). Each panel corresponds to one cluster derived from proteomic profiling.
Supplementary Figures
Figure S1. Gene Ontology (GO) Pathway enrichment analysis across selected immune cell types in ILNEB-associated fibrosis. The dot plot shows Gene Ontology Biological Process (GO: BP) pathway enrichment across selected immune cell types identified by single-cell RNA sequencing of patient and healthy PBMC samples. Each dot represents a significantly enriched pathway (adjusted p-value < 0.05, BH corrected). Dot size represents the number of differentially expressed genes contributing to each pathway, and the dot color corresponds to the p-value.
Figure S2. Heatmap of shared pathway enrichment across selected immune cell populations. The heatmap shows pathways shared across at least three independent immune cell types. Colors represent statistical significance expressed as -log10 adjusted p-values.
Figure S3. Violin plot showing normalized GZMH expression across selected immune cell types with significant differential expression between patient and healthy PBMC samples.
Be the first to comment on this publication.