Purpose
Background
ILNEB syndrome (Interstitial Lung disease, Nephrotic syndrome, and Epidermolysis Bullosa) is an ultra-rare, autosomal recessive disorder caused by biallelic loss-of-function mutations in ITGA3, encoding integrin α3. Fewer than 20 patients have been reported worldwide, and most affected infants die of progressive interstitial lung disease and renal failure before age two. The extreme rarity of ILNEB syndrome precludes cohort-based statistical approaches, making single-patient, multi-modal molecular profiling one of the only feasible strategies for biomarker discovery in this population.
Case Summary
We report a male patient with a clinical and histopathologic presentation consistent with ILNEB syndrome, who underwent a longitudinal, multi-tissue, multi-omics evaluation comprising long-read whole-genome sequencing (WGS), single-cell RNA-sequencing (scRNA-seq) of peripheral blood mononuclear cells (PBMCs), long-read (Iso-Seq) bulk transcriptomics of hair follicle tissue, and high-throughput plasma proteomics, benchmarked against matched or pooled healthy control samples.
Molecular Findings
scRNA-seq of PBMCs (10,662 control cells; 11,931 patient cells) identified significant shifts in immune cell cluster proportions and 4,089 significantly differentially expressed genes across 20 Leiden. Long-read Iso-Seq of patient versus control hair-follicle transcriptomes revealed differences in structural isoform composition, including a higher proportion of intergenic and incomplete-splice-match transcripts in the patient sample, alongside pathway enrichment for autophagy, ribonucleoprotein complex biogenesis, and RNA-splicing processes. Plasma proteomic profiling against unstimulated and stimulated healthy-control pools nominated a panel of high-variance immune mediators (including IFN-γ, IL-1β, IL-2, IL-4, IL-6, and CXCL8) that separated the patient from both control conditions on principal component analysis. Cross-omics integration of bulk RNA-seq, scRNA-seq, and proteomics data identified 45 genes concordant across at least three omics layers, representing the highest-confidence biomarker candidates despite the absence of biological replicates.
Clinical Implications
This integrative workflow demonstrates a feasible template for biomarker discovery in n-of-1 and ultra-rare disease settings, in which single-cell and long-read technologies partially substitute for cohort replication. Pending spatial transcriptomic/proteomic validation and genomic causal-inference analyses (Mendelian randomization using patient WGS-derived pQTLs) are proposed as the next steps to distinguish causal disease drivers from reactive bystander proteins and to guide future diagnostic and therapeutic prioritization in ILNEB syndrome.
C. Introduction
ILNEB syndrome is a monogenic, autosomal recessive multi-organ disorder caused by biallelic mutations in ITGA3 (OMIM 605025; disease entry OMIM #614748)1. Integrin α3 pairs with the β1 subunit to form the α3β1 heterodimer, a major receptor for laminin-332 in epithelial basement membranes of the lung, kidney, and skin2. Disease-causing mutations commonly disrupt the β-propeller domain of integrin α3, preventing normal N-linked glycosylation and blocking heterodimerization with β1; the unpaired mutant subunit is retained in the endoplasmic reticulum rather than trafficked to the cell surface, a mechanism paralleled by glycosylation-dependent trafficking defects described for other β-propeller-domain integrin subunits3. The resulting loss of basement-membrane integrity produces the clinical trial for which the syndrome is named: Interstitial Lung disease, Nephrotic syndrome, and Epidermolysis Bullosa (ILNEB)1 . Murine knockout studies confirm that α3β1 integrin is essential for normal lung alveolarization and kidney glomerular and collecting-duct development, providing a developmental basis for the multi-organ phenotype observed in humans4. Epidermolysis bullosa arising from ITGA3 loss is now classified within the junctional EB spectrum under the 2020 international consensus reclassification of inherited skin fragility disorders5.
Although first described as a uniformly lethal infantile disease, subsequent reports have shown that hylomorphic ITGA3 alleles (e.g., p.R274Q) permit survival into childhood or adolescence with attenuated, organ-restricted phenotypes, such as pulmonary fibrosis without nephrotic involvement6–7. This genotype-phenotype variability suggests that residual integrin function, modified by the specific mutation and its effect on protein folding and trafficking, shapes disease severity and organ tropism. Pulmonary fibrosis itself is mechanistically linked to integrin biology more broadly: integrin-mediated activation of latent TGF-β1, particularly via αvβ6, is a well-established profibrotic axis in both idiopathic and secondary pulmonary fibrosis8, and single-cell atlases of idiopathic pulmonary fibrosis (IPF) have identified aberrant epithelial and fibroblast populations that may share transcriptional features with ITGA3-driven lung disease9–10.
Because fewer than 20 ILNEB patients have been described worldwide, traditional case-control cohort statistics are not feasible, and no validated circulating or tissue biomarker exists for diagnosis, disease monitoring, or treatment response in this disorder. Multi-omics approaches, including combining genomics, transcriptomics, and proteomics, have been proposed as a strategy to compensate for small sample sizes in rare disease research generally11–12, and national genome sequencing initiatives have demonstrated meaningful diagnostic yield gains when multiple molecular layers are combined for rare disease patients (100,000 Genomes Project Pilot Investigators). However, the practical integration of short/long-read bulk transcriptomic, single-cell transcriptomic, and high-throughput proteomic data from a single ultra-rare-disease patient has not, to our knowledge, been systematically reported for ILNEB syndrome.
We present a single-patient, multi-tissue, multi-omics case study designed to (1) establish a reproducible pipeline for managing and cross-referencing heterogeneous omics data types in a rare disease, (2) apply single-cell and long-read sequencing approaches to partially overcome the statistical limitations of an n = 1 design, and (3) generate a tiered, cross-omics-concordant list of candidate biomarkers for ILNEB syndrome to prioritize for future spatial and functional validation.
D. Case Presentation
Available data extracted from the patient
To enable multi-omics biomarker discovery within this single-patient design, biospecimens were collected across multiple tissue compartments and benchmarked against matched or pooled healthy control material (Table 1).
| Omics Layer | Patient/Affected* | Control | Tissue |
|---|---|---|---|
| Long-read WGS | sample_1 | sample_2 | Blood |
| Bulk RNA-seq (Iso-Seq, long-read) | bc05 | bc06 | Hair follicle |
| Bulk RNA-seq (short-read) | sample_1 | sample_2 | Hair follicle |
| Single-cell RNA-seq | PBMC_5M_S1 | PBMC_5M_S2 | PBMC |
| Plasma proteomics | SEKI23_8003_V1 | R04_HD_Pool_0824 (+ R04_Stim_HD_Pool_Hi) | Plasma |
Table 1. In-house multi-omics resource table.
E. Results
E.1 Overview of Sequencing Methods
Four molecular layers were generated and analyzed for this patient: (1) single-cell RNA-seq of PBMCs13; (2) long-read full-length isoform sequencing (Iso-Seq) of hair-follicle RNA (PacBio); (3) long-read whole-genome sequencing of blood-derived DNA (PacBio HiFi); and (4) high-throughput plasma proteomics (Olink Explore HT proximity extension assay, quantifying 5,416 proteins as Normalized Protein eXpression [NPX], log2 scale)14. Additionally, a comprehensive workflow of the mutliomics data processing and analysis provide a solid significant gene list for later ILNEB further research (Figure 1).
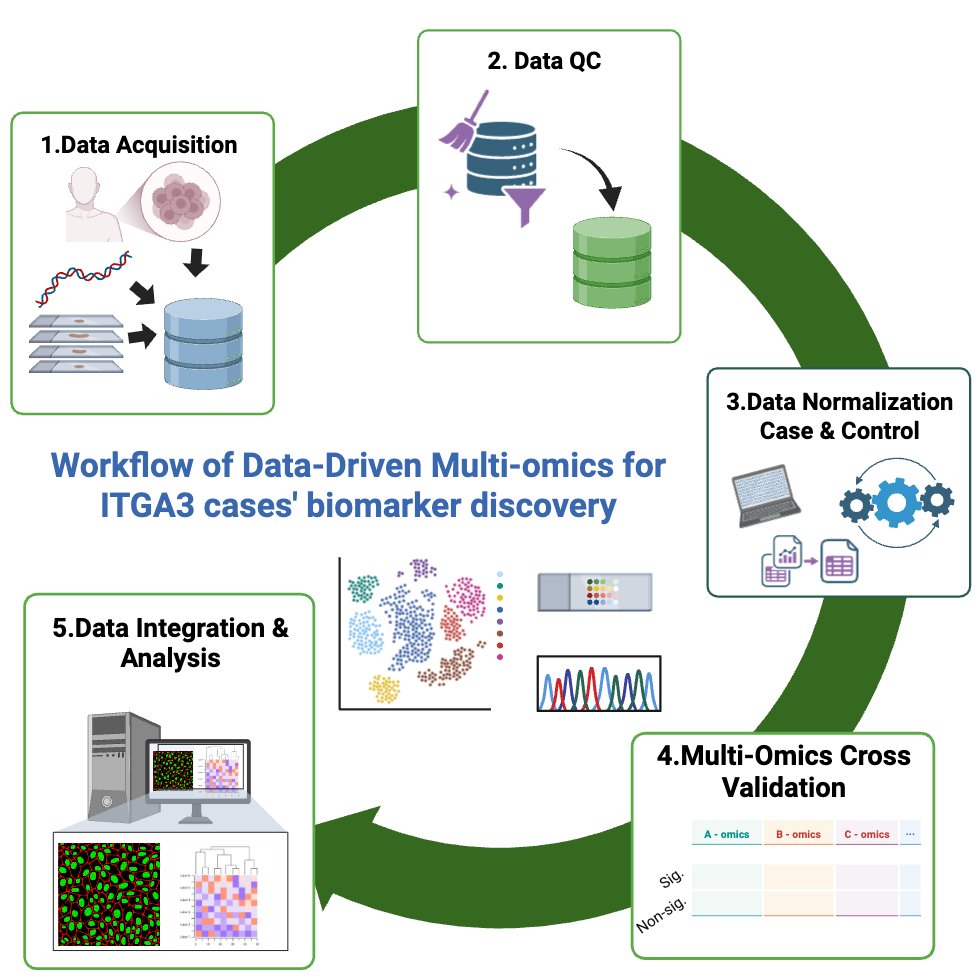
Figure 1. Workflow of the multi-omics data for the disease biomarker candidates filtering. The full workflow contained 1. Data acquisition, acquiring the omics data from the patient biopsy; 2. Data quality control (QC), evaluation and filtering of raw data to identify technical errors, contamination, missing values, or low-quality measurements; 3. Data normalization, statistical correction for technical variation while preserving biological variation. 4. Multi-omics cross validation, comparison of findings across different omics layers to confirm biological consistency. 5. Data integration and analysis, combining multiple omics datasets into a unified model for biological interpretation and discovery.
Because a traditional case-control cohort is unattainable for ILNEB syndrome, this workflow substitutes four complementary forms of within-study replication for between-patient replication, each addressing a different aspect of the small-sample problem. (i) Single-cell resolution as a partial substitute for biological replicates: scRNA-seq decomposes each PBMC sample into thousands of individual transcriptomes, allowing cluster-level and gene-level comparisons that would be statistically underpowered in bulk tissue. This substitution is partial cells from the same patient are not statistically independent biological replicates, and cell-level hypothesis testing (pseudo replication) is known to inflate the apparent significance of differential expression calls when only one biological sample contributes to each condition15; this caveat is addressed explicitly in the Discussion. (ii) Multi-tissue sampling as replication across compartments: rather than repeating measurements in the same tissue, this design samples blood (WGS, scRNA-seq), hair follicle (Iso-Seq), and plasma (proteomics), so that a candidate gene or pathway recurring across independent tissues and platforms provides a form of corroboration that a single bulk assay cannot. (iii) Dual-control benchmarking: the proteomic comparison against both an unstimulated and an ex vivo-stimulated healthy-control pool brackets the expected biological reference range despite the absence of a second ILNEB patient, reducing the risk that a single control value is misread as pathological. (iv) Cross-omics concordance filtering in place of multiple-testing correction across patients: with no second patient available for replication, we treated concordance across independent omics platforms as the primary control against false discovery, prioritizing the 45 proteins replicated in ≥3 of 4 layers over the much larger single-platform hit lists. Collectively, these strategies increase the information yield of a single patient but do not equate to, and should not be over-interpreted as, true biological replication.
E.2 Bulk Sequencing for different expressed genes identification
Workflow
Long-read WGS (PacBio HiFi) was performed on patient (sample_1) and control (sample_2) blood DNA. HiFi long-read sequencing provides high per-base accuracy (>99.9%) and improved structural variant sensitivity relative to short-read platforms, which is particularly advantageous for resolving complex or repetitive genomic regions relevant to ITGA3 variant calling. Specific variant(s) identified in ITGA3 in this patient.
Quality control and quantitative comparison
Full-length (Iso-Seq) sequencing of patient and control hair-follicle samples was processed through a standard pipeline, with read and transcript counts tracked at each stage which input full-length reads, clustering, mapping, collapsing, classification, and high-quality filtering (Figure 2A), confirming that comparable numbers of high-quality, full-length transcripts were retained for both groups and that any downstream differences are not attributable to sequencing depth or processing artifacts. Structural classification of the resulting full-length isoforms showed differences in gene-level distribution between patient and control (Figure. 2B), indicating that the two groups differ not only in expression level but in the diversity and structural composition of the isoforms each expresses. The proportion of transcripts assigned to each structural category, including full-splice match, incomplete-splice match, novel-in-catalog, novel-not-in-catalog, genic, intergenic, antisense, and fusion were compared between the two groups (Figure. 2C), showing a shift in the balance between known and novel/aberrant transcript forms in the patient, consistent with altered splicing or transcript processing. Differential expression analysis between patient and control identified transcripts that were significantly up- or down-regulated (Figure. 2D) pinpointing a discrete set of transcripts whose dysregulation distinguishes the patient from control at the molecular level. Functional enrichment of these differentially expressed genes highlighted the top 15 Gene Ontology Biological Process terms (Figure. 2E) and the top 20 KEGG pathways (Figure. 2F), with dot size reflecting gene count and color reflecting adjusted p-value, together linking the observed transcriptomic changes to specific biological processes and pathways that may underlie the patient's phenotype.
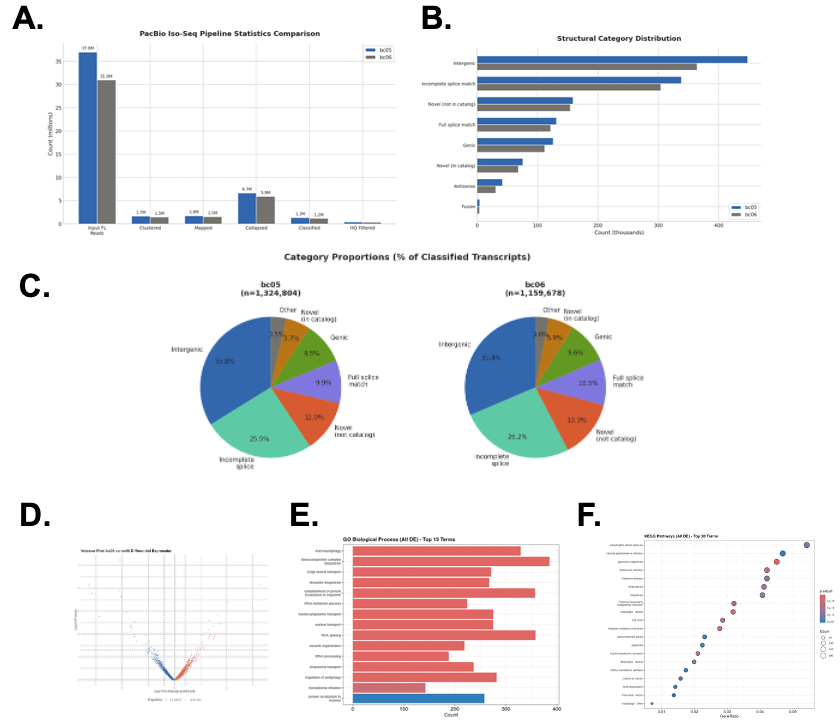
Figure 2. Bulk sequencing for the different expressed genes identification. A. Iso-Seq pipeline statistics for patient and control hair-follicle samples. Sequential read/transcript counts at each processing stage (input full-length reads, clustered, mapped, collapsed, classified, and high-quality filtered). B. Structural classification of full-length isoforms. The gene counts distribution of structural classification of full-length isoforms by patient and control; C. The percentage distribution of transcripts assigned to each structural category (full-splice match, incomplete-splice match, novel-in-catalog, novel-not-in-catalog, genic, intergenic, antisense, fusion for patient and control; D. The volcano plot of differential expression between patient and control (red/blue points indicate transcripts up-/down-regulated genes respectively; E. Top 15 enriched Gene Ontology Biological Process terms and F. top 20 enriched KEGG pathways among differentially expressed genes, the dot size reflects gene count, color reflects adjusted p-value.
E.3 Single-Cell Transcriptomic Analysis (scRNA-seq)
Workflow
Raw count matrices from Control and ITGA3_Mutant PBMC samples were loaded, merged with unique cell barcodes, and processed using a 13-step pipeline implemented primarily in Scanpy16 with Seurat-style variable-feature selection17. Cells were filtered to retain 200-5000 detected genes and <20% mitochondrial reads per cell (Figure. 3A) and the counts were normalized to 10,000 counts/cell and logarithm transformed. The top 2000 highly variable genes were selected in a batch-aware manner, followed by scaling and principal component analysis. Harmony was used to correct batch effects between Control and ITGA3_Mutant samples while preserving biological variation18. A “k = 15” nearest-neighbor graph was constructed on Harmony-corrected PCs, and Leiden clustering (resolution = 0.5) was performed19 followed by UMAP embedding for two-dimensional visualization (Figure. 3B)20.
Quantitative comparison
Cell-type proportions were compared between conditions using a chi-square test for the global distribution across all 20 clusters and Fisher's exact test per individual cluster (Figure C and D), an analysis designed to determine whether ITGA3 mutation alters the overall cellular composition of the tissue and, if so, to pinpoint which specific cell populations are affected. Several clusters showed significant proportional expansion or depletion in the ITGA3_Mutant sample (n = 11,931 cells) relative to Control (n = 10,662 cells), consistent with condition-associated shifts in immune cell composition, indicating that the mutation reshapes the immune cell landscape rather than uniformly affecting all populations. Differential gene expression was assessed per cluster using the Wilcoxon rank-sum test (ITGA3_Mutant vs. Control), a method shown in prior benchmarking to perform robustly relative to more specialized single-cell DE methods21, chosen to ensure that the transcriptional differences identified reflect genuine biological signal rather than method-specific artifacts. Across all clusters, 4,089 genes met significance thresholds for differential expression (Figure 4E), with the largest and most significant effect sizes observed in Cluster 0, identifying this population as the primary driver of the transcriptional dysregulation associated with ITGA3 mutation and a key candidate for downstream mechanistic follow-up.
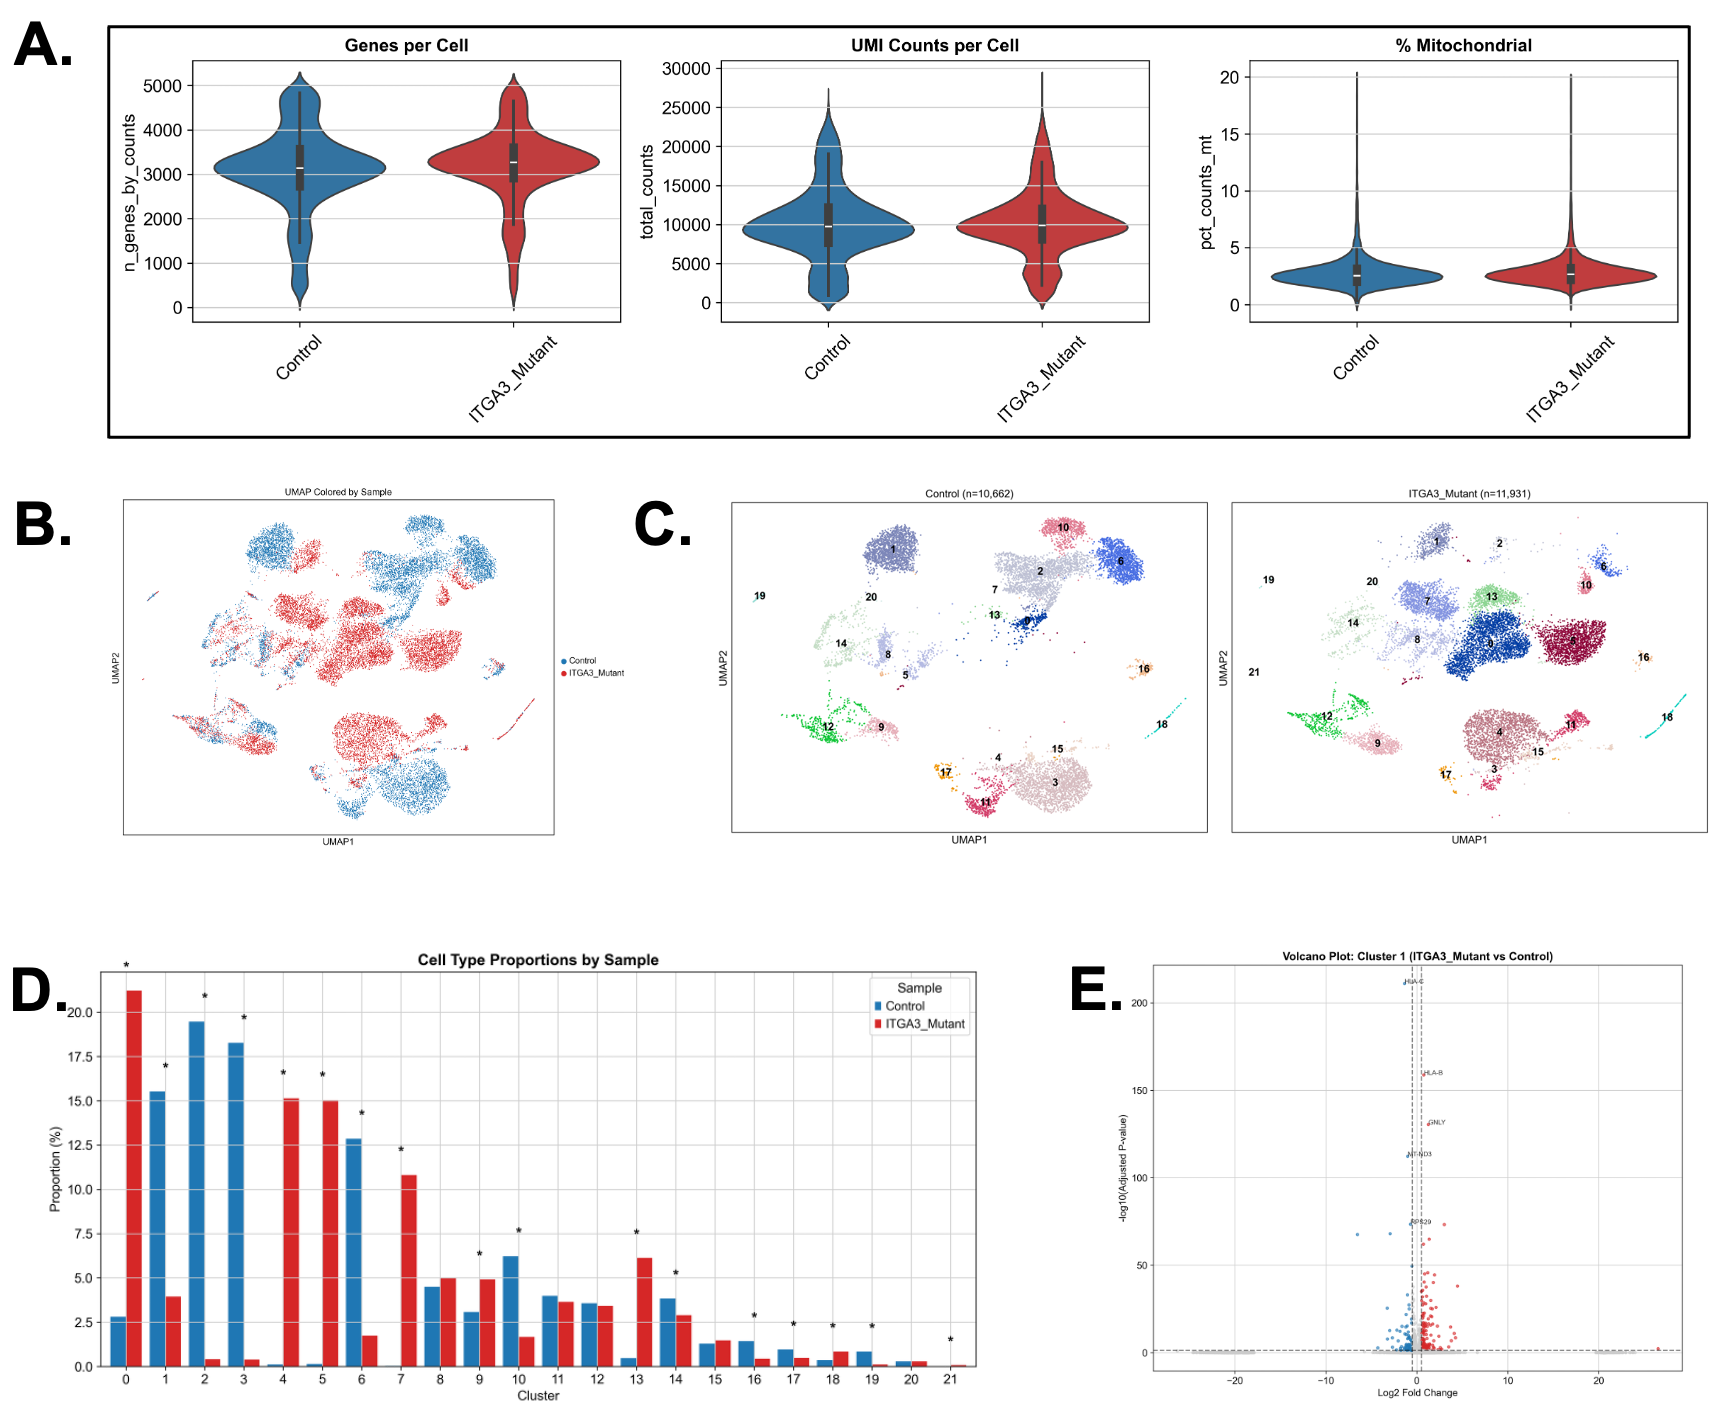
Figure 3. Single-cell analysis by the patient and control comparison. A. Quality control metrics for single-cell RNA-seq. Violin plots of genes detected per cell, unique molecular identifier (UMI) counts per cell, and mitochondrial read percentage, shown separately for Control and ITGA3_Mutant PBMC samples prior to filtering. Cells were retained if they had 200-5000 detected genes and <20% mitochondrial reads; B. Batch correction and cluster composition across Control and ITGA3_Mutant samples. UMAP split by sample (Control, n = 10,662 cells; ITGA3_Mutant, n = 11,931 cells) for direct visual comparison of cluster representation between conditions; C. UMAP embedding of single-cell transcriptomes colored by 21 Leiden clusters (resolution = 0.5); D. Quantitative comparison of cell-type proportions and differential gene expression between ITGA3_Mutant and Control PBMCs. Cell-type proportion (%) per cluster by sample; asterisks denote clusters with statistically significant differences (Fisher's exact test per cluster; chi-square test for global distribution); E. Representative volcano plots for Clusters 0 (ITGA3_Mutant vs. Control); x-axis, log2 fold change; y-axis, −log10 adjusted p-value.
E.4 Plasma Proteomic Analysis
Workflow
Plasma from the patient (SEKI23_8003_V1) was profiled alongside an unstimulated healthy-control pool (R04_HD_Pool_0824, reflecting resting immune status) and a stimulated healthy-control pool (R04_Stim_HD_Pool_Hi; ex vivo PBMC activation with LPS and PMA/ionomycin, reflecting an immunologically challenged baseline) using the Olink Explore HT proximity extension assay platform14. This dual-control design allows interpretation of the patient's proteomic signature against both resting and activated healthy reference states, improving specificity for candidate biomarker nomination. A spiked technical control was used for QC only and excluded from comparative analysis. Assay and sample QC pass rates were 99.7% (Figure. 4A), and NPX value distributions were comparable across samples after normalization (Figure. 4B), supporting the validity of downstream comparisons.
Findings
Principal component analysis of standardized NPX profiles separated the affected patient's plasma sample from both control conditions along PC1 (63.7% variance explained) and PC2 (36.3% variance explained) (Figure. 4C), and pairwise sample correlation was lower between the patient and either control (r = 0.61–0.65) than between the two control conditions (r = 0.77), consistent with a distinct disease-associated proteomic signature. Hierarchical clustering of the top 50 most variable proteins revealed co-expression modules that distinguished the patient from control samples (Figure. 4D). Among the top 20 highest-variance proteins, several innate and adaptive immune mediators were prioritized as candidate biomarkers, including interferon-gamma (IFNG), interleukin-1β (IL1B), interleukin-2 (IL2), interleukin-4 (IL4), interleukin-6 (IL6), and CXCL8/IL-8, alongside vimentin (VIM) and other structural/regulatory proteins.
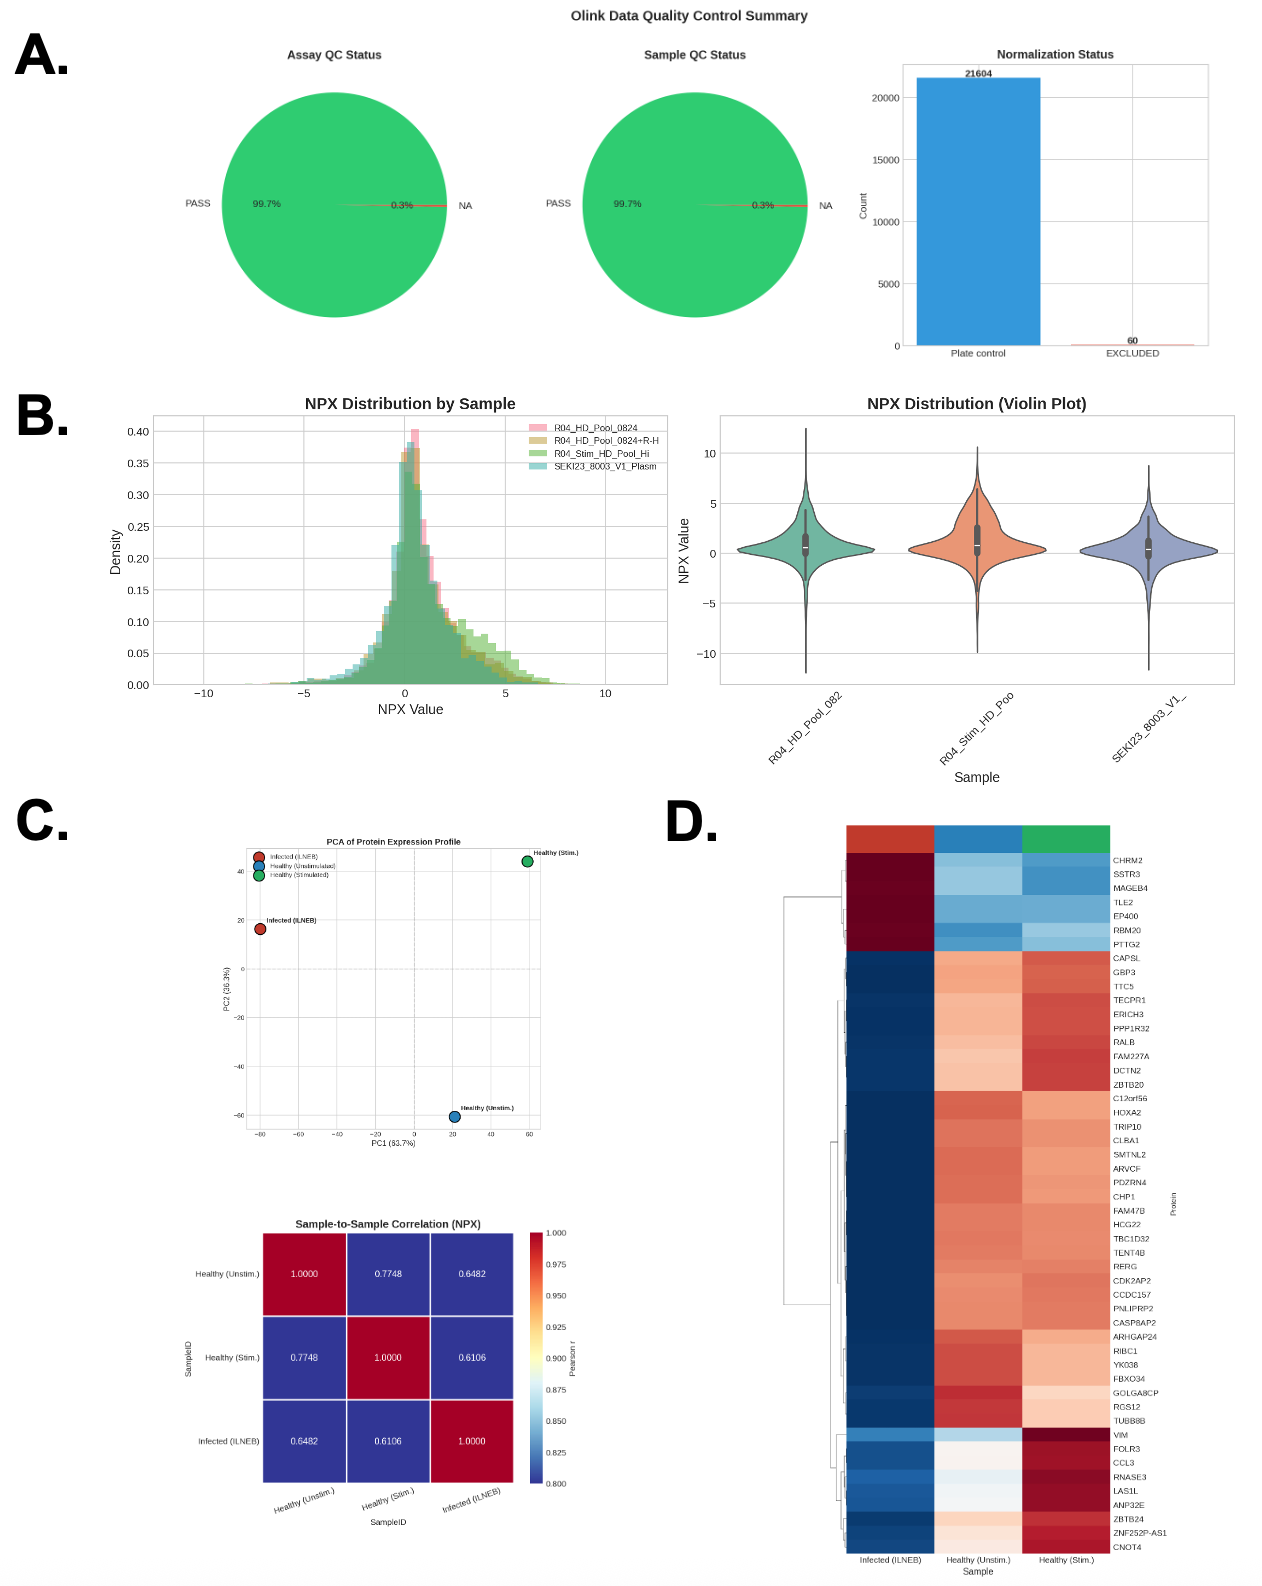
Figure 4. Proteomics data comparison by the patient, and healthy (unstimulated/stimulated) samples. A. Quality control summary for plasma proteomic (Olink Explore HT) data. Pass/fail rates for assay QC and sample QC, and normalization coverage, across all Normalized Protein eXpression (NPX) data points (99.7% PASS for both assay and sample QC); B. Distribution of NPX values by sample. Per-sample histograms (left) and violin plots (right) of NPX values for the patient (SEKI23_8003_V1), unstimulated healthy-control pool (R04_HD_Pool_0824), and stimulated healthy-control pool (R04_Stim_HD_Pool_Hi); overlapping distributions and comparable medians indicate successful normalization across samples; C. Principal component Analysis and correlation analysis of the plasma proteome. The upper PCA of standardized NPX profiles for the affected patient and healthy (unstimulated/stimulated) control samples, with percentage variance explained annotated on each axis. The bottom Pairwise Pearson correlation matrix among the three proteomic samples; D. Z-score heatmap of the top 50 most variable plasma proteins across patient and control samples, with hierarchical clustering highlighting co-expression modules that distinguish disease from healthy states.
E.5 Multi-Omics Integration
Workflow
Candidate genes identified through bulk RNA-seq (Iso-Seq/edgeR), scRNA-seq, and plasma proteomics were cross-referenced by HGNC gene symbol to identify convergence across independent molecular layers. Venn analysis was first used to assess three-way and pairwise overlap among the three primary datasets (Figure. 5A). Then the detailed genes ID were transformed as protein ID which convenient for significant candidate selection at both gene and protein levels among multiomics data Building on these overlap patterns, a tiering scheme conceptually related to multi-omics factor analysis frameworks used to identify cross-modal signal robust to individual clinical variation22 help with ranking candidate genes by the number of omics layers supporting them, with the goal of reducing the false-positive risk inherent to single-layer detection in an n = 1 study design. Note that tier number here denotes decreasing (not increasing) stringency: Tier 1 (all four layers) and Tier 2 (≥3 layers) represent the highest-confidence candidates, while Tier 3 (≥2 layers) is a broader, lower-stringency pool intended for pathway-level enrichment rather than individual biomarker nomination.
Integration Analysis
Venn analysis identified a modest but meaningful three-way overlap shared across all layers, demonstrating that a core set of genes is detected independently across transcriptomic and proteomic platforms, which strengthens confidence that these genes reflect genuine disease-associated biology rather than platform-specific noise. The four-layer UpSet analysis confirmed that single-layer detections dominate the union set (Iso-Seq only: 3,787 genes; scRNA-seq only: 3,253 genes; proteomics only: 1,336 genes) (Figure. 5B), underscoring that the large majority of candidate genes are platform-specific and would carry a high false-positive risk if prioritized without cross-omics support. High-confidence, cross-omics-concordant candidates were comparatively rare: 977 genes were supported by exactly two omics layers, and 45 genes ("Tier 2") were supported by three or more layers, with no genes reaching concordance across all four layers in this initial analysis, illustrating the rarity of full multi-omic convergence in a single-subject design and setting realistic expectations for how stringent cross-platform validation can be. Together, these tiers define a prioritized 1,022-gene "Tier 3" candidate pool (the union of the 45 Tier 2 genes plus the 977 two-layer-concordant genes) for downstream pathway enrichment and, ultimately, spatial and genomic validation, providing a statistically defensible candidate list sized appropriately for pathway-level analysis while reserving the smaller, higher-confidence Tier 2 set for individual biomarker follow-up.
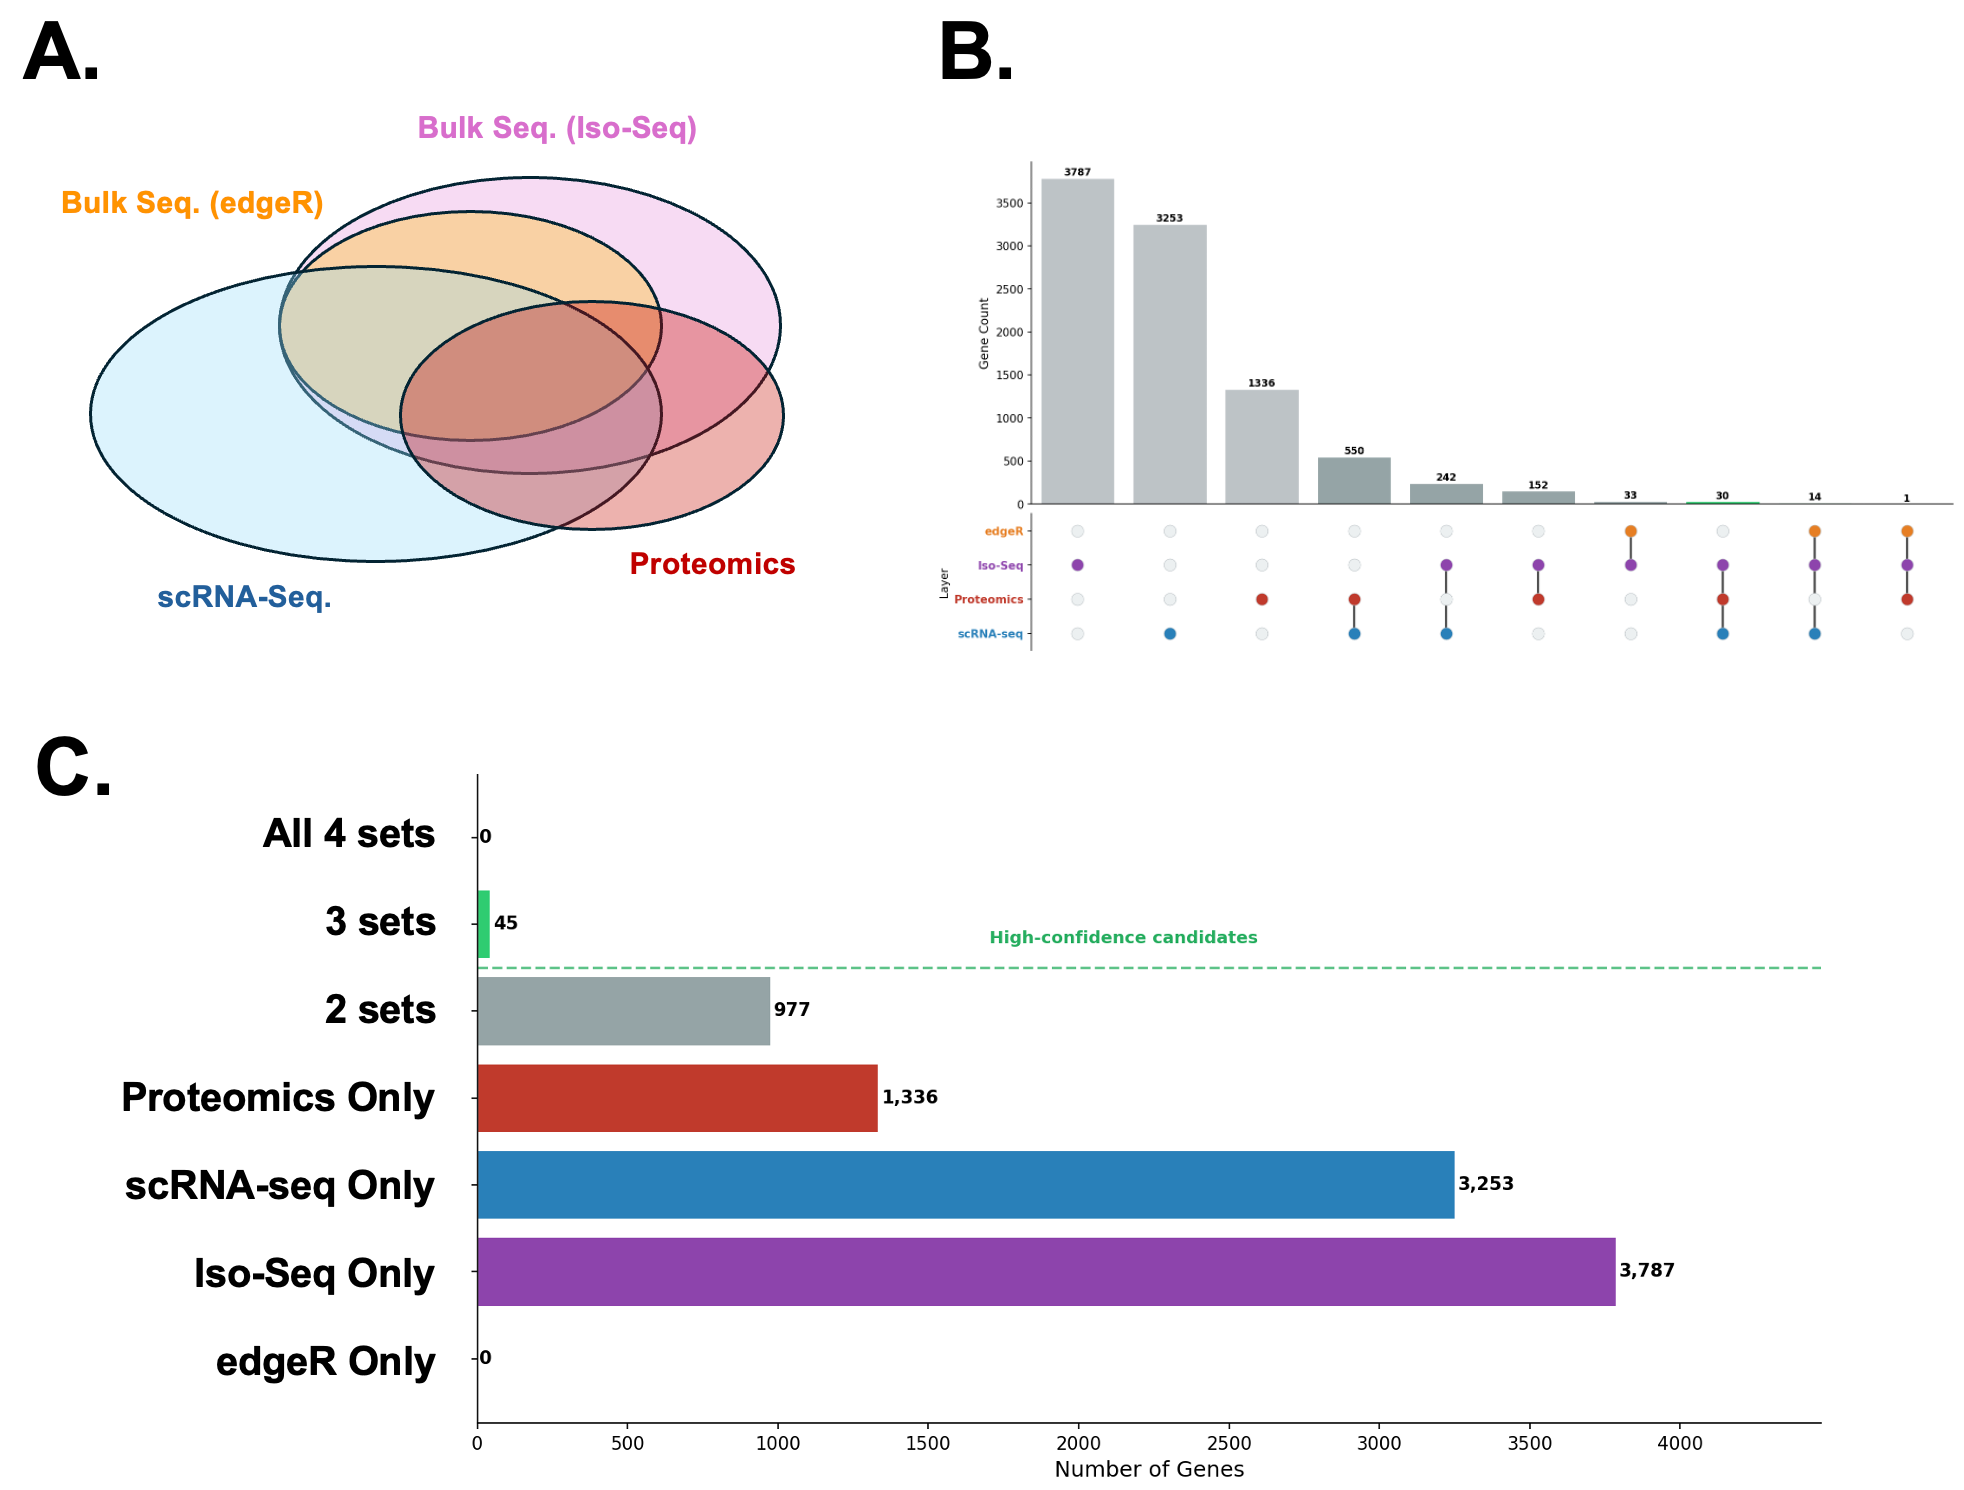
Figure 5. Multiomics data integration for biomarker candidate selection. A. The schematic figure of the data integration and filtering from four datasets, the transcriptomic data were separated as edgeR and Iso-seq methods which depends on the original sequencing methods. B. The upset plot describe the protein numbers of different intersection of the omics data. The omics data type and intersection present at the bottom dot section. C. The barplot present the protein descending candidates for classification by combination of different type omics datasets. The green dash line displayed a set of proteins with high-confidence by at least three sets from the multiomics data analysis.
F. Discussion
What makes this case unique and your approach?
Based on our review of the published ILNEB literature which has been non-systematic rather than a formal search we did not identify a prior report combining short-read WGS, scRNA-seq, long-read Iso-Seq, and high-throughput plasma proteomics in a single ILNEB syndrome patient. We therefore describe this as, to our knowledge, among the first such four-layer multi-omics workflows applied to this disease, using single-cell resolution and cross-tissue, cross-platform concordance as a partial statistical surrogate for the biological replication that is structurally difficult to obtain in a disease with fewer than 20 reported cases worldwide1. Rather than relying on a single omics layer, the interaction of different multi-omics data, as our UpSet plot shows we used cross-omics concordance (≥3 of 4 layers) to shrink an initial pool of tens of thousands of layer-specific hits down to a tractable, high-confidence set of 45 genes for downstream validation. We emphasize that this concordance-based approach manages, but does not eliminate, the false-discovery risk inherent to an n-of-1 design.
How this expands current knowledge
Prior ILNEB literature has been largely limited to clinical case description and single-gene Sanger or exome-based variant confirmation. This study extends that literature by generating a transcriptome- and proteome-wide molecular signature associated with the disease and by proposing a generalizable analytic framework (multi-tissue sampling, single-cell resolution, cross-omics tiering) that could be applied to other ultra-rare monogenic diseases facing the same small-sample-size barrier to biomarker discovery.
Clinical implications
- Diagnosis: A validated circulating or transcriptomic biomarker panel could shorten the diagnostic odyssey for future ILNEB patients, complementing genetic confirmation, particularly in settings where genetic testing is delayed or inconclusive.
- Prognosis: Because genotype-phenotype correlation in ILNEB is imperfect, the hypomorphic alleles can produce organ-restricted, longer-surviving phenotypes. The molecular biomarkers of disease activity (e.g., the immune mediator panel identified here) may better track real-time disease trajectory than genotype alone.
Limitations
This report has both design-level and analytical/statistical limitations, each summarized below alongside the mitigation we propose in future work.
Design and generalizability limitations
- Single-patient design: All findings derive from one affected individual compared against unrelated or pooled controls; results are hypothesis-generating and cannot be generalized without replication in additional ILNEB patients. Future direction: participation in multi-site rare-disease registries and data-sharing consortia (analogous to the Undiagnosed Diseases Network model) to assemble a virtual comparison cohort.
- No functional validation of the causal variant: The specific ITGA3 variant(s) in this patient have not yet been functionally validated. Future direction: CRISPR-edited isogenic cell lines, minigene splicing assays, or glycosylation/trafficking assays to confirm pathogenicity and mechanism, as has been done for other reported ITGA3 alleles.
- Pseudo replication in scRNA-seq differential expression: The 4,089 significant genes reported in Section E.3 were called using per-cell Wilcoxon rank-sum tests, which treat each cell as an independent observation. Because both the patient and control PBMC samples each represent a single biological replicate, this approach is a well-documented case of pseudo replication that can substantially inflate the number and confidence of apparent differentially expressed genes15. This is the single most important statistical caveat on the scRNA-seq results and likely explains why scRNA-seq contributed the largest single-layer hit count in Figure 13B/14A. Future direction: re-analysis using pseudo bulk aggregation (summing counts per cluster per sample before testing) once additional patient and control replicates are available, and/or mixed-effects models (e.g., MAST or a generalized linear mixed model with patient as a random effect) that explicitly separate cell-level from patient-level variance.
- No replicate-based dispersion estimation in bulk Iso-Seq differential expression: The bc05-versus-bc06 comparison involved one patient and one control sample, with no biological or technical replicates from which to estimate within-group variance; standard count-based DEG tools (e.g., edgeR) require replicates to estimate dispersion reliably, so fold-change rankings here should be interpreted as descriptive rather than as formally powered hypothesis tests. Future direction: generation of technical or additional biological replicates, or use of empirical Bayes dispersion priors borrowed from public long-read reference transcriptome datasets.
- No per-analyte inferential statistics in the proteomic comparison: Because the proteomic controls are pooled samples rather than individually resolved replicates, Section E.5 reports descriptive comparisons (PCA, correlation, variance ranking) rather than formal per-protein hypothesis tests with defined variance estimates. Future direction: incorporation of individually resolved matched controls, or borrowing of population-scale variance/effect-size estimates from large reference proteomic cohorts such as the UK Biobank Pharma Proteomics Project23 to enable empirical Bayes shrinkage estimators for the candidate panel.
Future directions
Building on the pending analyses noted above, planned next steps include: (1) spatial mapping of Tier 2/3 candidate genes onto lung tissue regions to confirm cell-type localization and co-expression; (2) WGS-based Mendelian randomization/pQTL analysis to prioritize causal over reactive proteins; (3) pathway enrichment (GSEA/ORA) across the full 1,022-gene Tier 3 pool; (4) scRNA-seq cluster-level annotation of the 45 Tier 2 genes to guide spatial probe selection, using pseudo bulk-corrected statistics as noted above; and (5) development of a multi-omics predictive model (e.g., random forest) incorporating tiered candidate features, the ILNEB phenotype label, and augmentation with public rare-disease cohort data, pending expansion of the sample pool.
G. Conclusion
- Integrating long-read genomics, single-cell transcriptomics, long-read bulk isoform sequencing, and high-throughput plasma proteomics from a single ILNEB syndrome patient identified a tiered set of candidate biomarkers which most notably 45 genes concordant across ≥3 omics layers despite the absence of a traditional patient cohort.
- Molecular findings converge on proteostasis/ER-processing pathway dysregulation and a distinct circulating immune-mediator signature, both mechanistically consistent with the known trafficking defect caused by loss-of-function ITGA3 mutations.
- Cross-omics concordance filtering, rather than single-platform significance, is essential for controlling false-discovery risk in n-of-1 rare disease studies and should be considered a methodological template for other ultra-rare monogenic disorders.
- Translational impact will depend on completing pending spatial and genomic causal-inference analyses; this report establishes the priority candidate list and analytic pipeline needed to pursue that validation and, ultimately, biomarker-informed diagnosis and management of ILNEB syndrome.
Be the first to comment on this publication.